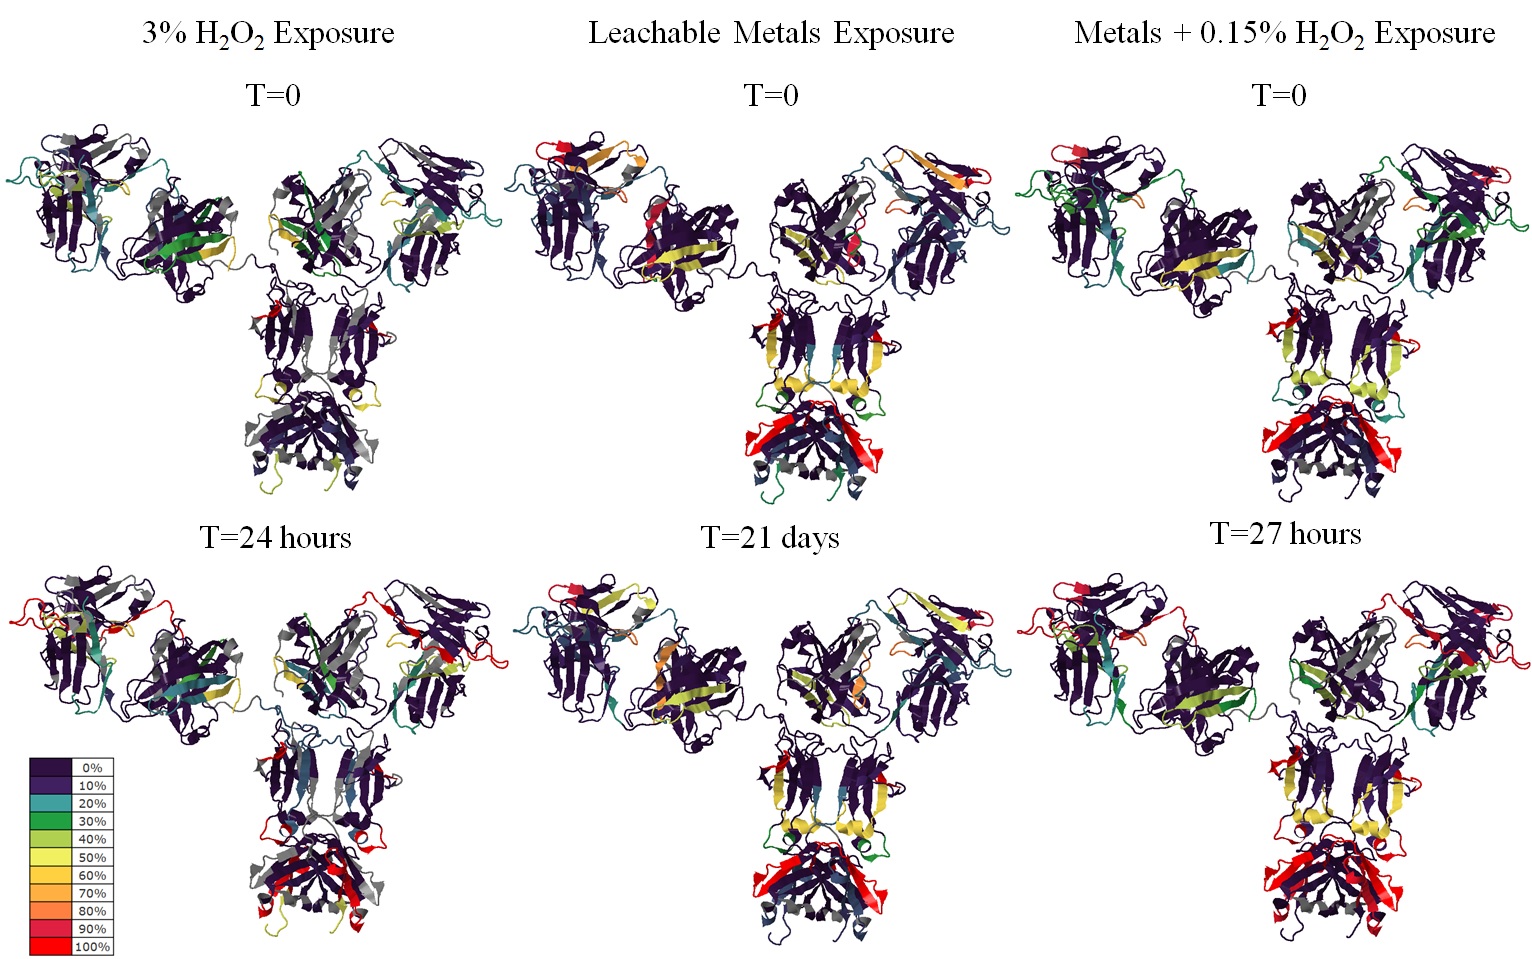
Figure. Global characterization maps comparing modifications of trastuzumab at starting and end time points of the three tested conditions. Each color band represents a proteolytic peptide. Color code represents average percentage of modifications of duplicated injections of single digestion. Peptides not detected were depicted grey.