Global characterization maps comparing modifications of trastuzumab
Annotated Global Characterization Map
Variable modifications
Supplement Methods
Supplement Experimental Procedures
Global characterization maps comparing modifications of trastuzumab
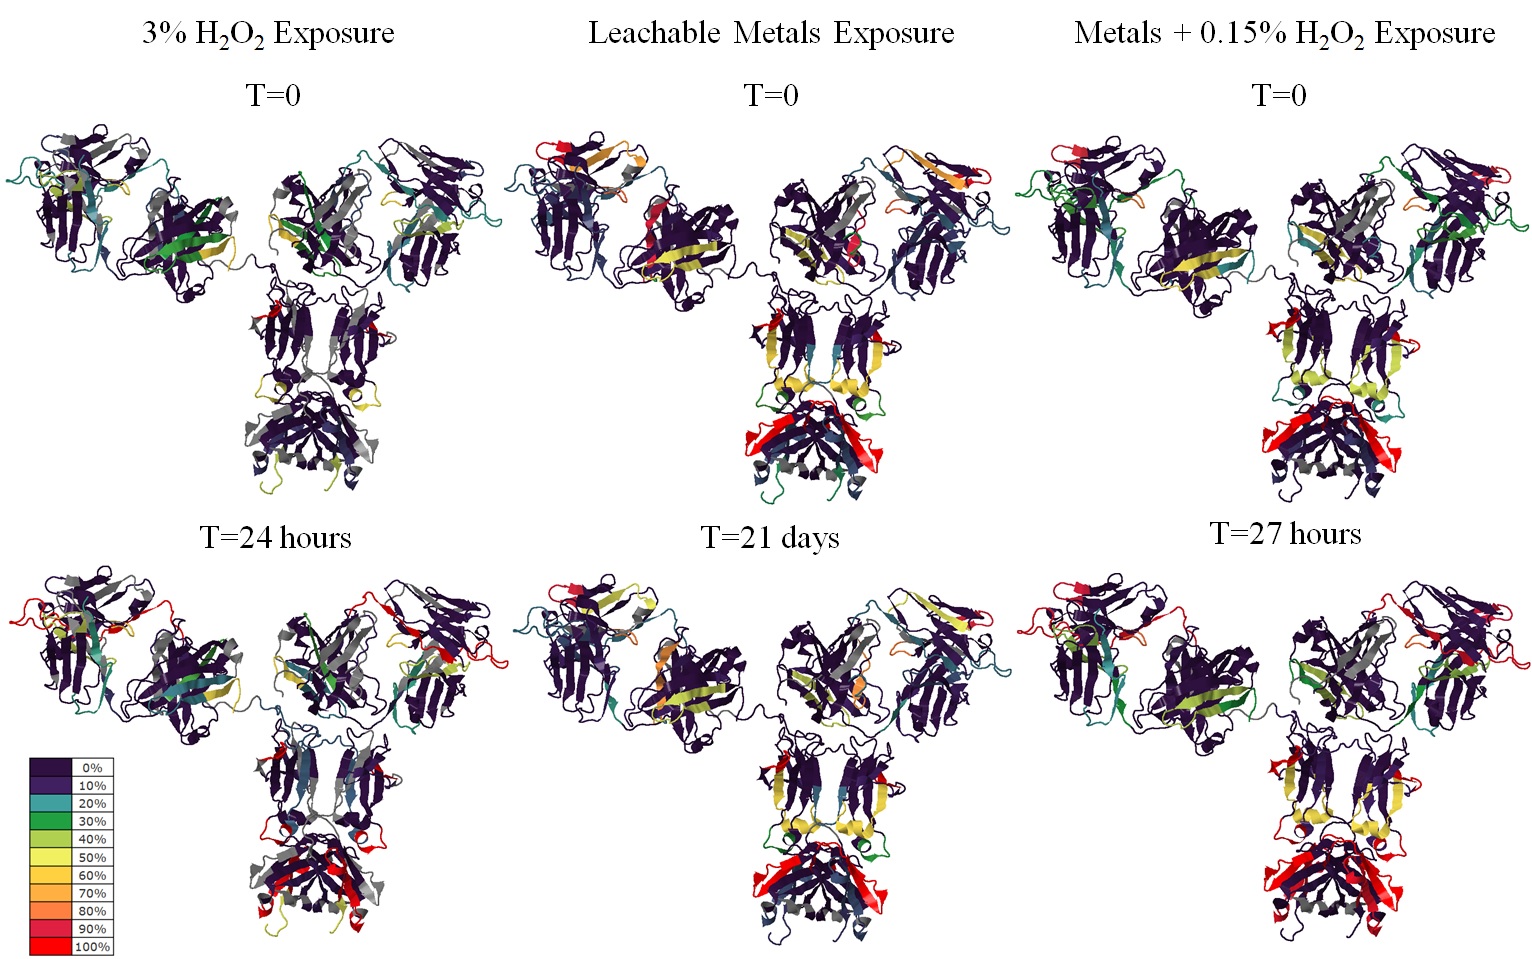
Figure. Global characterization maps comparing modifications of trastuzumab at starting and end time points of the three tested conditions. Each color band represents a proteolytic peptide. Color code represents average percentage of modifications of duplicated injections of single digestion. Peptides not detected were depicted grey.
Annotated Global Characterization Map

Figure. Global characterization map of trastuzumab with majority of modifications annotated. Sequences that hide behind are unreachable, thus cannot be labeled. Each color band represents a proteolytic peptide. Color code represents average percentage of modifications of duplicated injections of single digestion. Peptides not detected were depicted grey (A). Frequency was calculated as number of modified amino acid divided by total number of this amino acid in trastuzumab (B). Propensity to chemical modifications is calculated as total percentage of modification divided by number of this modified amino acid (C). All figures above came from trastuzumab that was incubated with H2O2 and leachable metals at 25°C (±1°C) for 27 hours. *Gln H39 was determined to be 80% converted to pyro-glutamate on the C-terminus of tryptic peptide R.QAPGK.G [38, 42]. The deglycosylation site Asn H301 was not considered as deamidation in B and C
Variable modifications
Supplement Methods
LC-MS Settings for Tryptic Digest
Mobile phase A and B were 0.1% formic acid (FA) in water and acetonitrile, all in LC-MS grade. A Thermo Scientific TM Ultimate TM 3000 UHPLC system delivers 0.2 mL/min gradient as follows: roughly 10 µg digests were loaded onto a Waters® BEH C18 150 x 2.1 mm, 1.7 µm column with 2% B for 4 min, the mobile phase B was linearly increased to 40% for 60 min and increased to 100% for another 3 min, the 100% B lasted for 4 min before a 10 min column equilibration at 2% B. A Thermo Scientific TM Q-Exactive TM plus (extended mass resolution) mass spectrometry was used for the data collection with the following settings: sheath gas flow rate, 25; aux gas flow rate, 15; sweep gas flow rate, 0; spray voltage, 3.5 kv; capillary temperature, 275°C; S-lens RF level, 55; aux gas heater temperature, 400°C; MS resolution, 70,000; positive mode; AGC target, 3e6; Maximum IT, 150 ms; scan range, 300-2000 m/z; with centroid spectrum data collected. DIA settings were detailed in Experiential Procedures.
LC-MS Settings for Chymotryptic Digest
LC mobile phases are the same above. The LC gradients are: sample loading at 2% B for 4 min, mobile phase B linearly increased to 35% for 50 min and increased to 100% for 4 min, column washing with 100% B lasted for 4 min, and equilibration at 2%B for 10 min. The MS scan settings are the same as the tryptic peptide analysis. DIA settings are detailed in Experiential Procedures.
Supplement Experimental Procedures
LC-MS Settings for Tryptic Digest
Mobile phase A and B were 0.1% formic acid (FA) in water and acetonitrile, all in LC-MS grade. A Thermo Scientific TM Ultimate TM 3000 UHPLC system delivers 0.2 mL/min gradient as follows: roughly 10 µg digests were loaded onto a Waters® BEH C18 150 x 2.1 mm, 1.7 µm column with 2% B for 4 min, the mobile phase B was linearly increased to 40% for 60 min and increased to 100% for another 3 min, the 100% B lasted for 4 min before a 10 min column equilibration at 2% B. A Thermo Scientific TM Q-Exactive TM plus (extended mass resolution) mass spectrometry was used for the data collection with the following settings: sheath gas flow rate, 25; aux gas flow rate, 15; sweep gas flow rate, 0; spray voltage, 3.5 kv; capillary temperature, 275°C; S-lens RF level, 55; aux gas heater temperature, 400°C; MS resolution, 70,000; positive mode; AGC target, 3e6; Maximum IT, 150 ms; scan range, 300-2000 m/z; with centroid spectrum data collected. DIA settings were detailed in Experiential Procedures.
LC-MS Settings for Chymotryptic Digest
LC mobile phases are the same above. The LC gradients are: sample loading at 2% B for 4 min, mobile phase B linearly increased to 35% for 50 min and increased to 100% for 4 min, column washing with 100% B lasted for 4 min, and equilibration at 2%B for 10 min. The MS scan settings are the same as the tryptic peptide analysis. DIA settings are detailed in Experiential Procedures.
